121+ Black Friday Statistics for 2024: Insights into Consumer Behavior
Black Friday, an annual shopping extravaganza, has evolved into one of the most eagerly anticipated events on the retail calendar. On this day, consumers across the United States and beyond embark on a shopping frenzy, seeking incredible deals and Black Friday discounts. It’s a day when brick and mortar stores and e-commerce platforms alike experience a surge in sales, and shoppers seize the opportunity to check items off their wishlists at bargain prices.
However, beneath the surface of this shopping spectacle lies a treasure trove of data-driven insights and statistics that reveal the true magnitude of Black Friday weekend. Let’s delve into the significance of Black Friday as a shopping event.
Table of Contents
- Key Black Friday Statistics
- Exploring Historical Black Friday Statistics
- Total Black Friday Sales Stats and Figures
- E-commerce Dominance During Black Friday
- Consumer Spending Habits and Black Friday Stats
- Black Friday Discount Stats
- Black Friday vs. Cyber Monday
- Retailer Insights and Black Friday Statistics
- Safety and Incidents
- Online Shopping Trends During Black Friday
- Generational Preferences and Black Friday Stats
- Conclusion and Takeaways
Key Black Friday Statistics
Black Friday 2023 is expected to be larger than ever, with a record-setting $9.12 billion spent online in the US, indicating the continued dominance of e-commerce in driving sales during the event[5].
According to finder.com, adults in the US are expected to spend a total of $148.5 billion on Black Friday and Cyber Monday[1].
Tidio’s report on Black Friday statistics states that the total revenue from the last holiday season amounted to nearly $1.27 trillion[2].
Forbes reported that Black Friday 2022 saw a 2.3% increase in online sales from 2021, with an estimated total of $9.12 billion spent online[3].
According to Moosend, Black Friday spending reached $9.12 billion in 2022, which was 2.3% more than in 2021[4].
Men are planning to spend over $100 more than women on Black Friday, with American men expected to spend an average of $724.46 compared to $610.71 for women, as per finder.com[1].
Over 140 million people planned to shop on Black Friday in the US alone in 2022, according to Tidio’s Black Friday report[2].
The National Retail Federation and Prosper Insights & Analytics reported a record 196.7 million consumers shopped both online and in stores between Thanksgiving Day and Cyber Monday, as mentioned in Forbes[3].
Black Friday weekend traffic rose up to 2.9% compared to last year, and in the US, retail sales on Black Friday rose 12% year over year, according to Moosend[4].
According to Tidio, the number of online shoppers decreased from 64% to about 55% during the last year’s holiday shopping season, indicating that more online holiday shoppers went to stores in 2022 compared to the previous year[2].
Shopify reported record sales from Thanksgiving Day through Cyber Monday, with 52 million consumers globally spending $7.5 billion on Shopify merchants, a 19% increase over last year, as mentioned in Forbes[3].
According to Moosend, Thailand had the lowest Black Friday shopping rate at 74% compared to the average, and in the US, sales in athletics had an increase of 153%[4].
The same source also reported that books, music, and clothing accessories sales doubled, and there were significant increases in sales for duvet covers and mattresses in the US[4].
Tidio’s Black Friday report also revealed that over 60% of Black Friday shoppers think there are too many people in the shops during Black Friday, and most people (77%) would be interested in booking an alternative shopping experience to avoid the crowds[2].
Forbes highlighted that despite the record online spending on Black Friday, consumers’ concerns about the economy are at the highest level since the Great Recession in 2008-2009[3].
According to Moosend, last year’s Black Friday still grew globally and favored both in-store and eCommerce shopping, with the latter winning the show as COVID-19 restrictions started to fade[4].
Forbes reported that traditional brick-and-mortar store purchases are still expected to account for the majority of retail holiday spending, with the National Retail Federation expecting 67% of Black Friday shoppers to have headed to stores[3].
Cyber Monday is expected to top Black Friday online sales, with totals reaching $11.2 billion, and a record 196.7 million people shopped over the weekend between Thanksgiving Day and Cyber Monday[3].
Citations:
[1] https://www.finder.com/black-friday-statistics
[2] https://www.tidio.com/blog/black-friday-trends/
[3] https://www.forbes.com/sites/qai/2022/12/04/black-friday-sales-numbers-hit-record-highs-despite-fears-of-recession/?sh=7911c7666c1f
[4] https://moosend.com/blog/black-friday-stats/
[5] https://www.storyly.io/post/black-friday-statistics-you-should-know
Exploring Historical Black Friday Statistics
Tracing the growth of Black Friday reveals a dynamic evolution in retail and consumer habits. From its modest beginnings to becoming a global phenomenon, let’s explore notable Black Friday statistics that showcase how shopping patterns, spending trends, and retail strategies have changed over the years, reflecting broader economic and social shifts from brick and mortar to online stores.
In 2022, Black Friday online sales grew 3.5% to $65.3 billion globally[1].
The total number of Thanksgiving shoppers grew significantly from 174.6 million in 2017 to 189.6 million in 2019, with the number of online Black Friday shoppers reaching the 100 million mark for the first time[2].
Black Friday spending reached $9.12 billion in 2022, which was 2.3% more than in 2021[3].
Black Friday 2020 witnessed significant drops in traffic due to the COVID-19 outbreak, but there was a rise in average transaction value[3].
Black Friday 2023 is expected to be larger than ever, with a record-setting $9.12 billion spent online in the US in 2022[4].
In 2019, Black Friday online sales reached $65.3 billion globally, indicating a preference for digital shopping[1].
In 1939, President F.D. Roosevelt attempted to change the time of Thanksgiving to boost the economy by extending the holiday shopping period[1].
Black Friday continues to be the biggest shopping day of the year in the United States, influenced by factors such as inflation, supply chain disruptions, and pandemic-related habits[5].
Citations:
[1] https://growthrocks.com/blog/black-friday-history-facts/
[2] https://financesonline.com/black-friday-statistics/
[3] https://moosend.com/blog/black-friday-stats/
[4] https://www.storyly.io/post/black-friday-statistics-you-should-know
[5] https://www.tidio.com/blog/black-friday-trends/
Total Black Friday Sales Stats and Figures
As Black Friday shoppers around the world eagerly await Black Friday deals, the retail industry gears up for one of its most significant sales events. This section presents an in-depth look at the total sales generated on Black Friday, providing an analysis of how these figures have evolved nationally and globally.
We’ll break down these numbers by product categories and industries, offering a detailed view of where consumers are spending their money and how these trends compare year over year.
Here is a table showing the sales volume by industry on Black Friday in 2021:
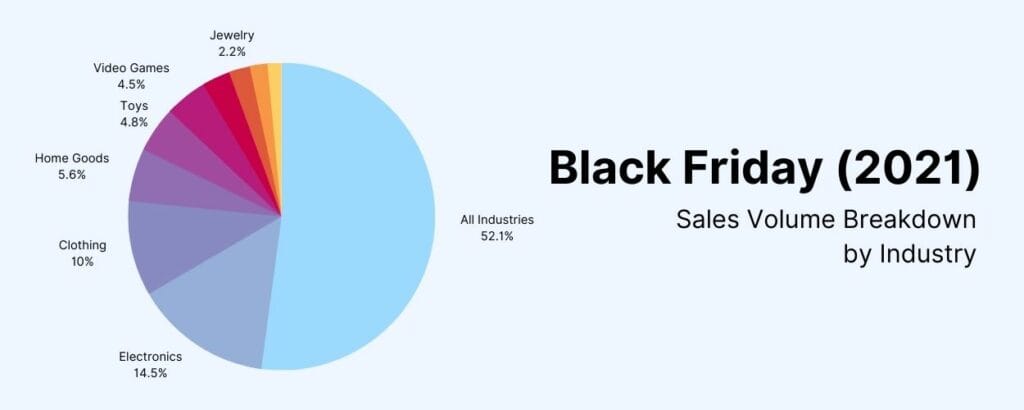
The Kids industry saw an increase in both sales and revenue, with sales increasing by 6.1% and revenue increasing by 3.3% on Black Friday in 2022[1].
The Marketplace industry experienced a significant decrease in both sales and revenue, with a drop of 13.9% in orders and 12.3% in revenue on Black Friday in 2022[1].
The Fashion industry also saw a decline in sales and revenue, with a 10.1% drop in orders and a 7.7% decrease in revenue on Black Friday in 2022[1].
Black Friday 2022 saw the weakest sales growth across the five days of Cyber Week, with a 2.3% year-over-year increase to $9.1 billion in the U.S[2].
Thanksgiving online sales grew 2.9% year-over-year in the U.S., reaching $5.3 billion in sales in 2022[2].
87.2 million U.S. consumers shopped online on Black Friday in 2022, roughly equal to 2021[2].
Despite lower sales overall, there is a growing importance of Grocery retailers taking advantage of Black Friday and Cyber Monday activities[5].
Citations:
[1] https://helloretail.com/industry-performance-report-on-black-friday-2022/
[2] https://queue-it.com/blog/black-friday-statistics/
[3] https://moosend.com/blog/black-friday-stats/
[4] https://www.statista.com/topics/8714/black-friday-worldwide/
[5] https://nielseniq.com/global/en/insights/analysis/2022/black-friday-and-cyber-monday-2022-by-the-numbers/
E-commerce Dominance During Black Friday
The digital realm has increasingly overshadowed physical stores in store shopping and during Black Friday sales. Here are some notable facts showcasing the robust growth of online shopping, highlighting how e-commerce platforms have altered the Black Friday landscape.
E-commerce sales accounted for about 21% of global retail sales in 2022, marking a 50% increase from pre-pandemic levels[1].
In 2021, online sales on Black Friday rose to about 22% year-over-year to $9 billion, indicating the increasing significance of e-commerce during the shopping event[4].
Amazon’s product views were up 8% and purchases were up 18% from the previous year, demonstrating the platform’s strong performance on Black Friday[1].
Purchases on smartphones accounted for 40% of all online spending on Black Friday, highlighting the increasing role of mobile e-commerce in driving sales[1].
In 2022, social commerce accounted for about 4.5% of all online purchases in the US, underscoring the growing impact of social media platforms on e-commerce sales[1].
Black Friday 2022 saw a record-setting $9.12 billion spent online in the US, indicating the continued dominance of e-commerce in driving sales during the event[5].
The rise of e-commerce has led to a shift in consumer behavior, with a whopping 94% of shoppers planning to do their shopping online in 2022[1].
In 2021, more than 74% of US consumers started their product searches on Amazon, underscoring the platform’s dominance in e-commerce and its impact on traditional retail[1].
Citations:
[1] https://www.similarweb.com/blog/ecommerce/retail-insights/black-friday-stats/
[2] https://www.statista.com/topics/8714/black-friday-worldwide/
[3] https://www.zippia.com/advice/black-friday-statistics/
[4] https://financesonline.com/black-friday-statistics/
[5] https://www.storyly.io/post/black-friday-statistics-you-should-know
Consumer Spending Habits and Black Friday Stats
Black Friday not only marks a peak in sales but also reveals varied spending habits among different consumer groups. Let’s look at some Black Friday statistics that illustrate who shops on Black Friday, how their spending habits differ, and which product categories see the highest sales.
The average spend during Black Friday is expected to exceed 2022, in some countries by as much as 22%, indicating a record consumer spending during the event[1].
US consumers plan to spend the most on Black Friday, and Cyber Monday with an average spend of $460, followed by Switzerland ($390), and Germany ($385)[1].
Consumers are turning to November sales events less for high-end items and more to cover their basic needs, with adult clothing and consumer electronics being the most favored product categories across countries[1].
Black Friday online sales reached $9.12 billion in 2022, marking a 2.3% increase from the previous year, according to Adobe Analytics[3].
Cyber Monday sales were 23.9% higher than Black Friday sales in 2022, with Americans spending a record $11.3 billion on the day[4].
The average Cyber Monday consumer spent between $113 and $147 in 2022, with the average consumer spending at least $113.45 on the day[4].
Cyber Monday revenue increased 20.2% from 2019 to 2022, with a projected 5.34% of all holiday shopping revenue coming from Cyber Monday sales[4].
Online consumers spent $10.7 billion on Cyber Monday in 2021, down 0.93% year-over-year[4].
Black Friday sales in athletics had an increase of +153% in the US in 2022, while books, music, and clothing accessories sales doubled[3].
Duvet covers and mattresses saw a +111% and +108% increase, respectively, indicating the popularity of home goods during Black Friday in 2022[3].
U.K. millennials planned to spend £209 on Black Friday 2022, showcasing the spending trends among different age groups[3].
Citations:
[1] https://www.bcg.com/press/9november2023-black-friday-cost-of-living-crisis-drives-hunt-for-bargains
[2] https://www.linkedin.com/posts/helloretail_blackfriday-industryreport-ecommerce-activity-7120668131483623425-lEGz
[3] https://moosend.com/blog/black-friday-stats/
[4] https://capitaloneshopping.com/research/cyber-monday-statistics/
[5] https://nielseniq.com/global/en/insights/analysis/2022/black-friday-and-cyber-monday-2022-by-the-numbers/

Black Friday Discount Stats
Black Friday is synonymous with some of the year’s most significant retail discounts.
Here is a look at the average discount rates across various product sectors and how these savings influence shopping trends, both in physical stores and online.
Black Friday Discounts Now Average Nearly 50 Percent, fueling the popularity of the event and driving consumer spending[1].
Men are expected to spend an average of $724.46 compared to $610.71 for women on Black Friday, reflecting a gender-based difference in spending patterns[3].
Mobile accounted for 66% of global Black Friday sales, highlighting the increasing significance of mobile commerce in driving sales during the event[1].
In 2022, ecommerce sales accounted for about 21% of global retail sales, marking a 50% increase from pre-pandemic levels, underscoring the growing influence of ecommerce on Black Friday sales[5].
SMS Marketing Can Result in as Much as a 2000% ROI During Black Friday, showcasing the effectiveness of SMS marketing in driving sales during the event[1].
Citations:
[1] https://www.drip.com/blog/black-friday-statistics
[2] https://moosend.com/blog/black-friday-stats/
[3] https://www.finder.com/black-friday-statistics
[4] https://www.digitalcommerce360.com/article/black-friday-ecommerce-sales/
[5] https://www.similarweb.com/blog/ecommerce/retail-insights/black-friday-stats/
Black Friday vs. Cyber Monday
A Comparative Analysis
Black Friday and Cyber Monday each offer a unique perspective on consumer spending habits. This section delves into the statistics of both events, highlighting the differences in sales performance, the scale of discounts offered, and the types of products that dominate sales.
Understanding these nuances helps in grasping the broader trends in holiday shopping and how retailers strategize for each of these significant days.
Here are 12 statistics about Black Friday vs. Cyber Monday:
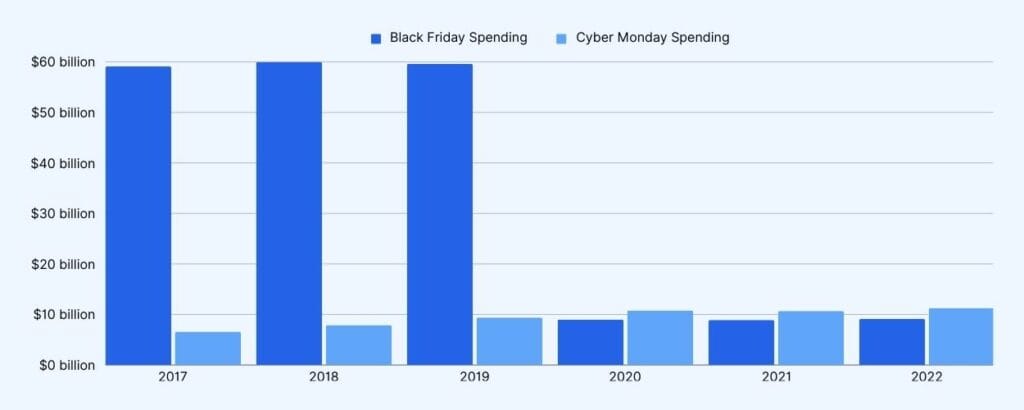
46% of consumers spent more on 2022 Black Friday sales, while only 27% spent the same amount. In contrast, more than half of online shoppers (71%) spent more on 2022 Cyber Monday sales compared to last year’s event[1].
In 2022, Black Friday online sales reached a record $9.12 billion, marking a 2.3% increase from the previous year, while Cyber Monday registered a whopping $11.3 billion at a 5.8% rise compared to 2021[2].
Black Friday saw the weakest sales growth across the five days of Cyber Week, with a 2.3% year-over-year increase to $9.1 billion in the U.S[3].
87.2 million U.S. consumers shopped online on Black Friday in 2022, roughly equal to 2021, while consumers spent an average of $325.44 on holiday-related purchases over the course of Cyber Week, up 8% from $301.27 in 2021[3].
Cyber Monday is steadily growing in popularity, with consumers spending $11.3 billion on Cyber Monday in 2022, indicating a 5.8% year-over-year growth[1].
Black Friday and Cyber Monday are prime days for holiday season shopping, making up 15.6% of all holiday season shopping sales in 2022, with the average American planning to spend $500 between Black Friday and Cyber Monday[5].
Globally, 35% of Gen Zs and 34% of Millennials say they’re sure they’ll make a purchase between Black Friday and Cyber Monday, while just 18% of Gen Xers and 7% of Baby Boomers are certain about shopping during that period[5].
Citations:
[1] https://influencermarketinghub.com/black-friday-vs-cyber-monday/
[2] https://growthdevil.com/amazon-black-friday-statistics
[3] https://queue-it.com/blog/black-friday-statistics/
[4] https://www.dealnews.com/features/cyber-monday/ways-cyber-monday-is-different-from-black-friday/
[5] https://explodingtopics.com/blog/cyber-monday-stats
Retailer Insights and Black Friday Statistics
Understanding how brick and mortar stores and online retailers navigate Black Friday offers valuable insights into the retail industry’s dynamics. Here are some Black Friday statistics for prominent retailers like Amazon, Walmart, and Best Buy during Black Friday.
Global businesses made an estimated $65.3 billion during the 2022 Black Friday sales, with nearly 13% of all retail sales in the United States occurring between Black Friday and Christmas[1].
In 2021, there were 155 million shoppers in the United States on Black Friday, and shoppers spent $8.9 billion online during the event[1].
E-commerce sales accounted for about 21% of global retail sales in 2022, marking a 50% increase from pre-pandemic levels, indicating the growing influence of online sales on Black Friday and the retail industry[2].
Black Friday Shoppers spent $6.3 million per minute online in 2020, with an average spend of $27.50 per person, and purchases on smartphones accounted for 40% of all online spending[2].
The average shopper spends $430 on Black Friday, and up to 155 million Americans shop on Black Friday, with 57% of them shopping online[5].
The top-selling products on Black Friday include “Apple Watch” with 550,000 purchases, “Dyson” with 450,000 purchases, and “PS5” with 368,000 purchases[5].
Citations:
[1] https://www.zippia.com/advice/black-friday-statistics/
[2] https://www.similarweb.com/blog/ecommerce/retail-insights/black-friday-stats/
[3] https://www.storyly.io/post/black-friday-statistics-you-should-know
[4] https://www.statista.com/topics/8714/black-friday-worldwide/
[5] https://capitaloneshopping.com/research/black-friday-statistics/
Amazon Black Friday Sales Numbers
Amazon’s Black Friday sales in 2022 saw a 2.3% increase on Black Friday, with Cyber Monday registering a significant $11.3 billion in sales, marking a 5.8% rise compared to 2021[1].
Amazon’s conversion rates grew to 9.6% during Black Friday, and the revenue soared to $34.5 billion in 2021, indicating a strong performance during the event[2].
Sales for the entire Black Friday Week in 2022 increased by 145% compared to the average for the same period, reflecting a substantial boost in sales during the event[3].
Amazon’s Black Friday sales in Germany increased by 440% on November 25, 2022, compared to the average sales of the previous week, demonstrating a significant surge in sales during the event[5].
Citations:
[1] https://growthdevil.com/amazon-black-friday-statistics
[2] https://www.similarweb.com/blog/ecommerce/retail-insights/black-friday-stats/
[3] https://remazing.eu/en/2022/12/16/analysis-black-friday-on-amazon-2022/
[4] https://www.storyly.io/post/black-friday-statistics-you-should-know
[5] https://www.statista.com/statistics/1368060/amazon-black-friday-sales-increase-europe/
Safety and Incidents
Black Friday Statistics
Safety issues during Black Friday create a complex dynamic for retailers and consumers. In this analysis, we present data on various Black Friday incidents, including crime, violence, and the unfortunate statistics on fatalities. The section highlights how these incidents are managed by retailers and law enforcement, and their impact on store sales and capacity.
About 15% of Black Friday-related injuries occur in parking lots, and 33% of accidents occur in retail stores, highlighting the potential dangers of Black Friday shopping[3].
Since 2006, there have been 12 reported deaths and 117 injuries attributed to Black Friday shopping, underscoring the need for enhanced safety measures and awareness among Black Friday shoppers and retailers[3].
Incidents such as shootings, pepper-spray attacks, and scuffles have marred Black Friday events, leading to injuries and fatalities, prompting concerns about shopper safety and security[2].
In 2020, two teens were shot and killed at a mall in Northern California on Black Friday, highlighting the potential for violent incidents during the event[1].
In 2021, several U.S. cities reported a bout of smash-and-grab robberies on Black Friday that were committed by different organized groups of thieves. In Los Angeles, a group reportedly stole $400 worth of products from Home Depot. Chicago reported four such robberies, and a Best Buy in Minnesota was robbed by a group of over 20 people in a smash-and-grab scheme[1].
Trampling incidents are a significant risk during Black Friday, as impatient crowds push towards their objectives, leading to individuals being trampled, highlighting the potential dangers of overcrowding and impatience during the event[4].
Citations:
[1] https://www.texasclarkfirm.com/blog/2022/november/five-common-black-friday-crimes/
[2] https://blackfridaydeathcount.com
[3] https://blog.gitnux.com/black-friday-injury-statistics/
[4] https://consumerdecisions.org/black-friday-statistics/
Online Shopping Trends During Black Friday
Technology has transformed the way consumers approach Black Friday.
Here are recent Black Friday statistics related to online shopping behavior, the use of mobile devices and social media in shopping, Black Friday website traffic, conversion rates, and online advertising:
In 2022, Black Friday spending reached $9.12 billion, marking a 2.3% increase from the previous year, with mobile shopping accounting for 55% of online retail sales, an 8.3% increase from the previous year[4].
Over 80% of people intend to shop on Black Friday and Cyber Monday, with 65% of customers planning to either shop in store or online, and 36% of them looking for deals on social media, emphasizing the growing importance of ecommerce and social media in shopping behavior[2].
Black Friday website traffic and conversion rates have shown a significant shift towards online channels, with 72 million in-store shoppers and 87 million online shoppers purchasing during Black Friday, surpassing Cyber Monday in online sales and indicating the dominance of online shopping during the event[4].
Retailers expect the bulk of Black Friday sales to come from online channels, with US consumers spending $9.12 billion online during Black Friday 2022, while Salesforce Inc. reported online retail sales reaching $17.2 billion, underscoring the increasing significance of online sales during the event[4].
Mobile shopping during Thanksgiving 2022 accounted for 55% of online retail sales, higher by 8.3% from the previous year[3].
In 2021, 43% of Black Friday sales happened through mobile phones, indicating the growing importance of mobile commerce in driving sales during the event[1].
In 2022, mobile shopping accounted for 66% of global Black Friday sales, highlighting the increasing significance of mobile commerce in driving sales during the event[1].
Citations:
[1] https://www.zippia.com/advice/black-friday-statistics/
[2] https://www.tidio.com/blog/black-friday-trends/
[3] https://influencermarketinghub.com/black-friday-consumer-behavior/
[4] https://influencermarketinghub.com/black-friday-consumer-behavior/
Generational Preferences and Black Friday Stats
The shopping behaviors of various generations during Black Friday and Cyber Monday offer fascinating insights into the broader consumer market.
Here are some recent Black Friday statistics about generational differences in Black Friday shopping.
The majority of Gen Z and Millennials engaged in Black Friday shopping in 2022, while over 60% of baby boomers and 55% of Gen X did not shop in the sales[1].
In the UK, Generation Z tends to shop the most for others on Black Friday, with over 80% of consumers in this category doing so in 2021. Only 50% of Baby Boomers who shopped on Black Friday did so for other people[1].
Generation Z will be hunting for bargains this holiday shopping season, with 68% of those surveyed saying they plan to shop the Black Friday sales[3].
Younger consumers use Black Friday as a time to get gifts for loved ones and find deals for themselves. Gen Zs and millennials are likely to plan ahead and are on social media the most, so outreach via posts and stories are essential for these groups[2].
Although Gen Zs are not spending as much time looking for deals compared to shoppers spend other generations, and are the lowest to say they’re price-conscious, they are the most likely to plan their Black Friday shopping. 40% of Gen Z shoppers say they start planning two weeks or more in advance[2].
Only 18% of US consumers say they wait for major sales events like Black Friday to make major purchases, down 11% from Q2 2020. Among those more likely to be shopping for gifts are Gen X and baby boomers. Both generations are more likely to not be sure what they’re buying quite yet, but our data suggests that clothes could be a popular gift this year[2].
Parents with children aged 18 and under in their household are one of the most likely groups to shop on Black Friday (75%), but unlike older generations, they seem to have specific items in mind. They’re more likely than the average Black Friday shopper to plan on buying a gaming device and personal electronics, both of which match up with some of the most desired gifts from US kids aged 8-15[2].
In 2021, 43% of Black Friday sales happened through mobile phones, indicating the growing importance of mobile commerce in driving sales during the event[1].
Citations:
[1] https://techreport.com/statistics/black-friday-shopping-statistics-trends/
[2] https://blog.gwi.com/trends/black-friday-trends/
[3] https://www.finder.com/black-friday-statistics
[4] https://www.statista.com/statistics/1346430/consumes-who-regret-past-black-friday-purchases/
[5] https://www.onlinedasher.com/black-friday-statistics/
Conclusion and Takeaways
As we wrap up our look at Black Friday, it’s clear that this day is more than just a chance to shop for Black Friday deals. It’s a big event that shows us a lot about how people spend money, how stores sell things, and how shopping is changing, both in stores and online.
The facts and trends we’ve talked about are really useful for anyone who wants to get a better understanding of Black Friday. Whether you’re a store owner planning for the next big sale, someone working in marketing, or just a regular shopper, these insights can help you make smarter choices.
We encourage you, our readers, to keep learning about Black Friday. The information we’ve shared is just the beginning. Black Friday is a big deal and it tells us a lot about shopping trends in the world today.
If you want to know more about Black Friday and stay on top of the latest trends, dive into the details, talk about it with others, and keep an eye on how this special shopping day is changing. It’s a great way to understand more about how we all shop and make decisions.